Recently visited
"Recently Visited" allows you to see your click-through history.
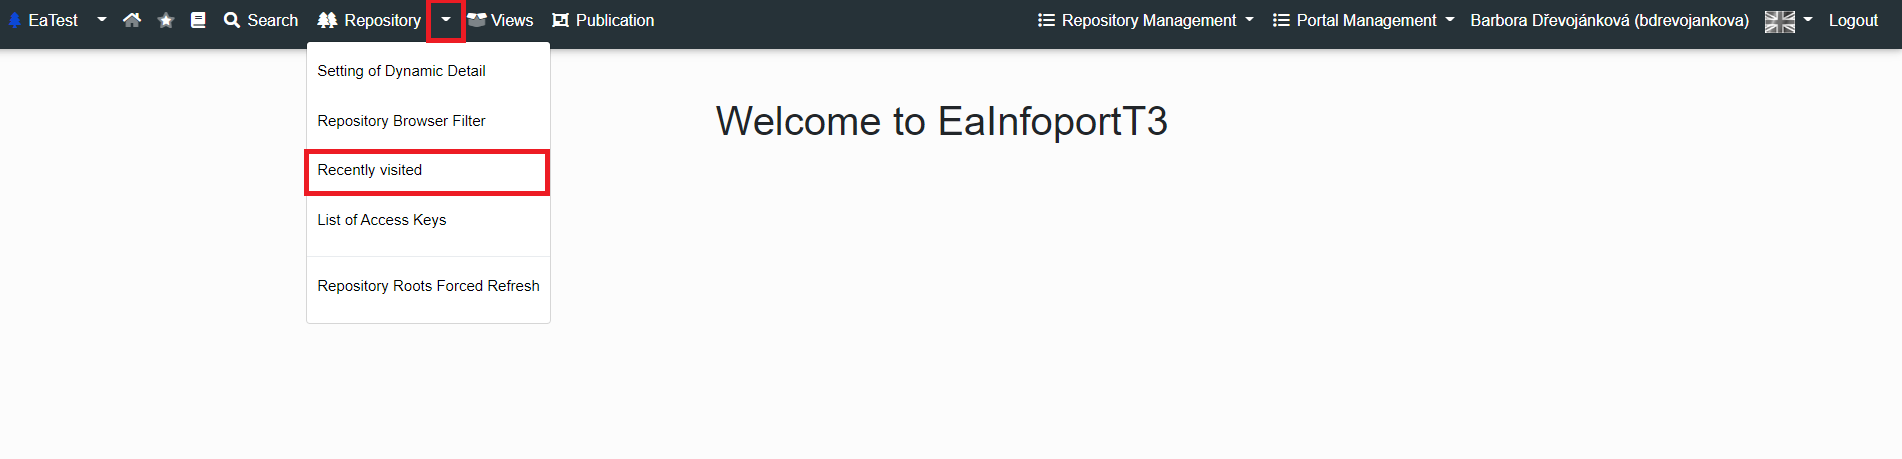
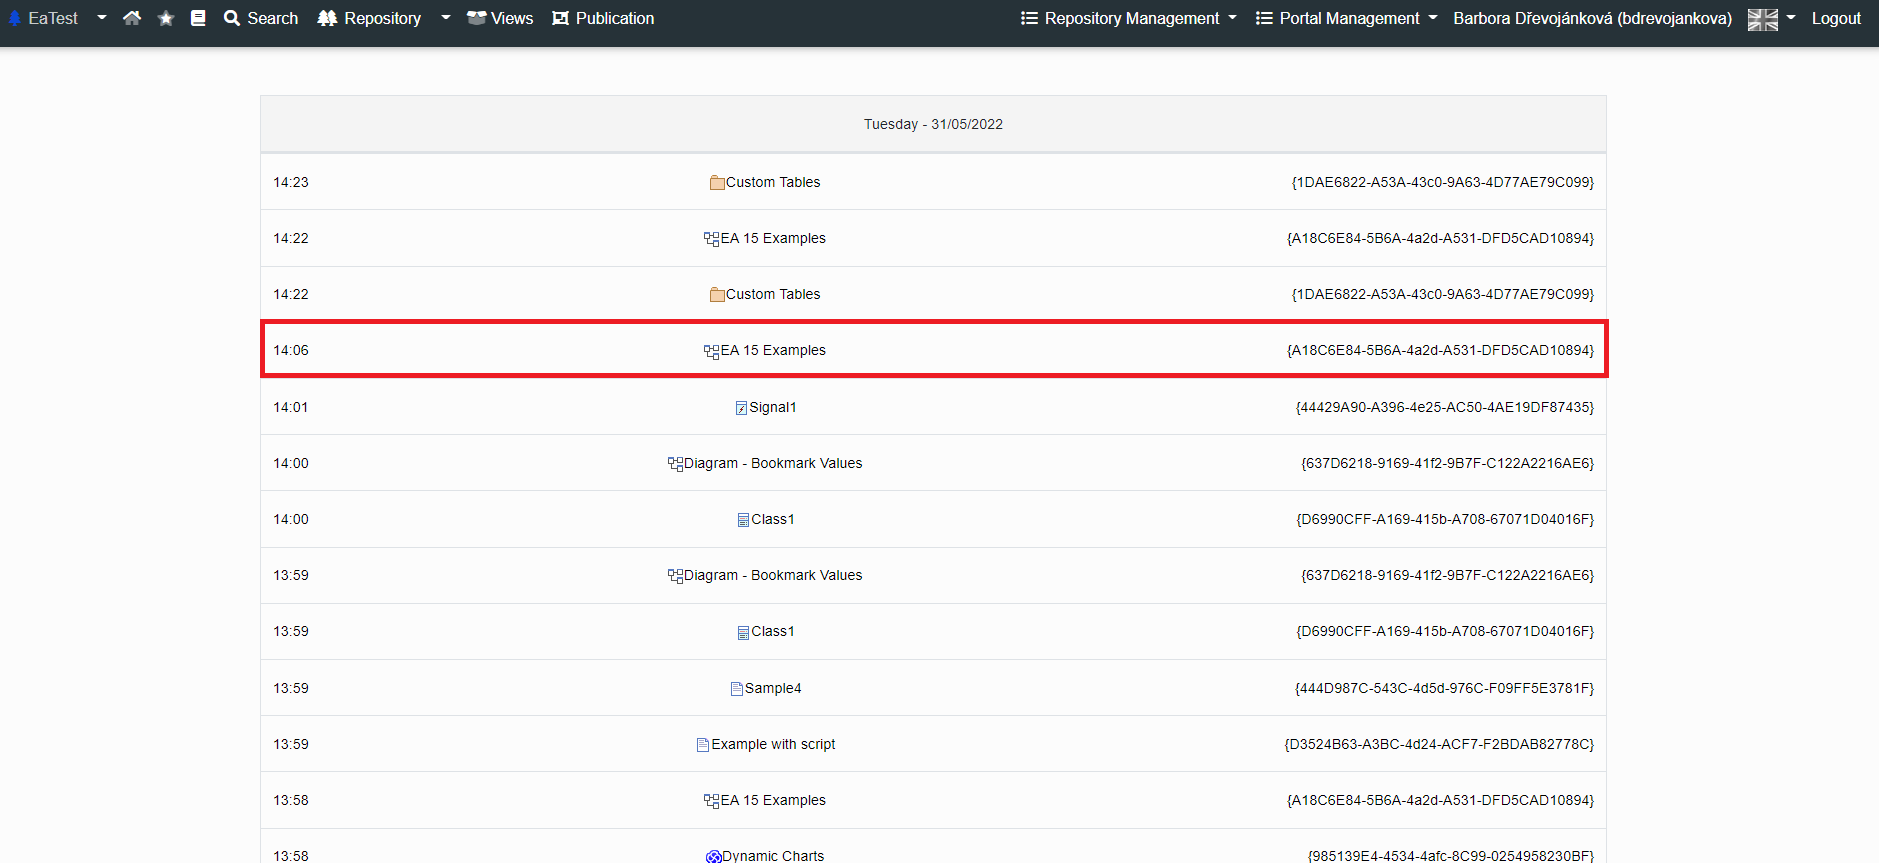
In the table we see:
- Date
- Time
- Diagram/element/package/attribute/operation - the line can be clicked on the artifact
- GUID
Visit statistics - reading directly from the database (for administrators)
Every successful opening of a detail (diagram, element, package, attribute, operation, root package of a model) is recorded in the table infoport."VisitedDetails" in the Infoport database. This table is the source of the "Recently visited" function. The application provides no screen or statistics for administrators over this table; the data can only be read directly with an SQL query against the database.
Structure of the table infoport."VisitedDetails"
| Column | Meaning |
|---|---|
| ID | Primary key (auto-increment). |
| UserId | Reference to AspNetUsers.Id. When a user is deleted, their records are deleted too. |
| RepositoryId | Reference to Repositories.Id. |
| Guid | EA GUID of the displayed item (ea_guid). |
| DetailKind | Item type: 1 = diagram, 2 = element, 3 = package, 4 = attribute, 5 = operation, 10 = model (root package). |
| VisitTimestamp | Server time (local server time, not UTC). |
There are indexes only on the UserId and RepositoryId columns; there is no index on VisitTimestamp.
When a record is created
- One row is created for every successful opening of a detail.
- Nothing is merged: a page refresh, a forced refresh or opening the same item again creates another row.
- When access is made through a public key, the visit is recorded under the user who owns the key.
- Rejected access (403/404), browsing the tree, searching, IP addresses and sessions are not recorded.
Retention - important for statistics
A nightly maintenance job deletes records older than the value of CleanAfterXDays. The default value is 30 days and it is set in the Configuration Manager. In the default schedule the job runs at 01:00 and it also runs when the application starts. For long-term statistics you therefore need to increase this value, or archive the data every day (for example into an aggregation table).
Example queries (PostgreSQL)
-- user activity
select u."UserName", count(*) as views, count(distinct v."Guid") as unique_items,
       count(distinct v."VisitTimestamp"::date) as active_days, max(v."VisitTimestamp") as last_visit
from infoport."VisitedDetails" v
join infoport."AspNetUsers" u on u."Id" = v."UserId"
group by u."UserName"
order by views desc;

-- most visited items
select "RepositoryId", "DetailKind", "Guid", count(*) as n, count(distinct "UserId") as users
from infoport."VisitedDetails"
group by 1, 2, 3
order by n desc
limit 50;

-- daily trend
select date_trunc('day', "VisitTimestamp") as day, count(*) as views, count(distinct "UserId") as users
from infoport."VisitedDetails"
group by 1
order by 1;

-- hourly trend
select extract(hour from "VisitTimestamp") as h, count(*) as views
from infoport."VisitedDetails"
group by 1
order by 1;

-- ratio of item types
select "DetailKind", count(*) as views
from infoport."VisitedDetails"
group by 1
order by 1;

-- "sessions": a gap longer than 30 minutes starts a new session
select t.*, sum(is_new) over (partition by "UserId" order by "VisitTimestamp") as session_no
from (
  select v.*, case when "VisitTimestamp" - lag("VisitTimestamp") over w > interval '30 min'
                     or lag("VisitTimestamp") over w is null then 1 else 0 end as is_new
  from infoport."VisitedDetails" v
  window w as (partition by "UserId" order by "VisitTimestamp")
) t;
With the lag("Guid") function you can also follow transitions from one item to another, that is, how users navigate through the model.
Limitations
- Item names are missing. The table contains only the GUID. The name and type must be looked up in the Enterprise Architect database of the given repository (t_object, t_diagram, t_package, t_attribute, t_operation by ea_guid). It is a different database, so a connection (dblink/FDW) or an export is required.
- Deleted items cannot be found in EA. The application silently omits them from the user's history.
- Repeated openings inflate the counts, so distinguish count(*) from count(distinct ...).
- Visits through a public key cannot be distinguished from regular visits of the key owner.
- Slow queries on large data: there is no index on VisitTimestamp. An index on (UserId, VisitTimestamp) would pay off.
Another data source - the Insights log
If you need a record of all HTTP requests (not just the opening of details), enable the Insights option in the Configuration Manager (App Logs) and set Log Type to Debug. Each request is written to the file insights.log in the log folder (LogPath) in the format: [duration] [status code] [user or no user] [address including query and request body, for login without the password]. The file is rolled according to the RollingInterval setting. Note: Debug writes the content of requests, so use it only temporarily and in an internal environment.